
Source paper: Cash flow grades - scheduling rocks with different throughput characteristics - King, B. (1999)
The cash-flow grades paper addresses a subtle but important scheduling problem. Simple grade, equivalent grade, dollar grade, and net value can all be misleading when ores have different processing rates. In a constrained plant, the highest-grade rock is not always the best rock to process first if it consumes too much scarce processing time.
The paper derives cash-flow grade from the period cash flow contribution of treating a block as ore instead of waste, multiplied by its ore processing rate. In plain terms, it asks how much value a rock contributes per unit of processing time, not merely how much value it contains per tonne.
This matters most when the operation can selectively mine materials with different hardness, chemistry, recovery, or throughput behaviour. A few high-grade hard blocks may produce less period value than more tonnes of slightly lower-grade but faster-processing material. The ranking system must therefore reflect both value and the rate at which that value can be turned into cash flow.
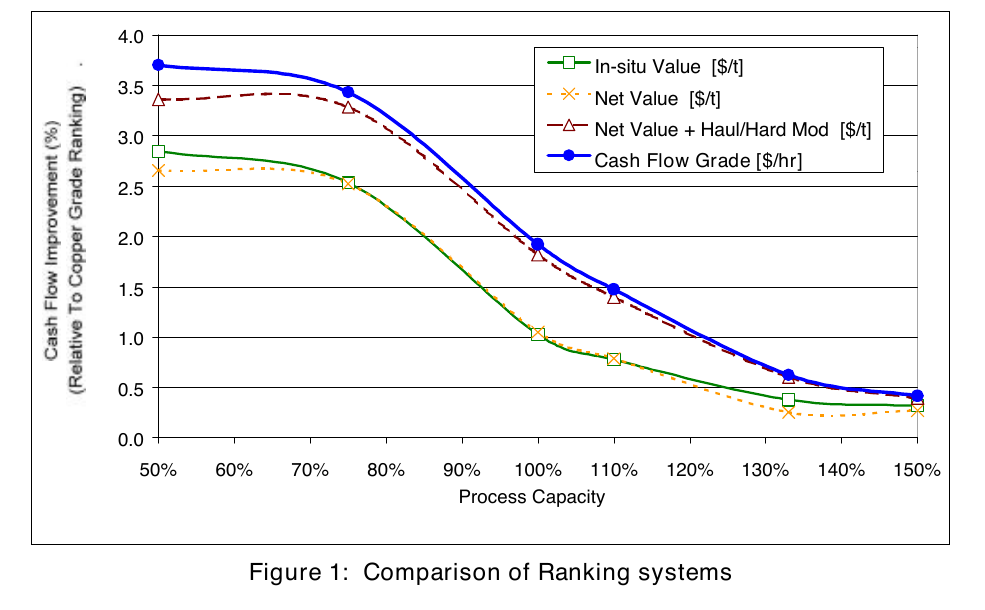
The paper compared five ranking systems across processing capacities from 50 to 150 per cent of nominal capacity. The cash-flow grade ranking produced the highest value at all tested processing capacities. The benefit was strongest at lower processing capacities, where scarce mill time made the ranking decision more valuable.
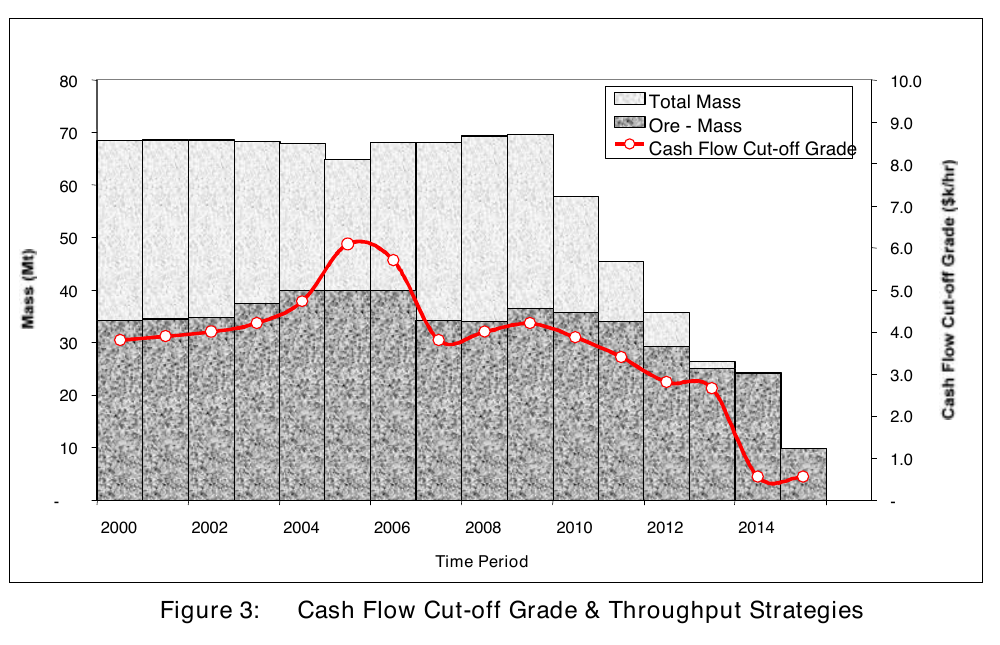
Cash-flow grades also connect naturally to cut-off grade strategy, stockpiling, multiple processing streams, and open pit plus underground scheduling. The same principle can be used to decide whether material should be ore or waste, and then which process stream should receive it.
The broader insight is that a mine schedule should rank material according to the constrained value objective it is trying to maximise. Once throughput, recovery, cost, and timing differ between rock types, a static grade proxy can become too blunt for strategic planning.